Why Being Aware of Outliers is Vital for Machine Learning Datasets

The growing role of data and analytics as both a business optimization strategy and actionable insights into customer behavior means that there is a defined need for companies to understand how certain statistical rules will be impacted by rogue data outliers or unexpected anomalies. Data is a commodity, but the increased adoption of machine learning algorithms raises the bar significantly.
There is a consensus among statisticians that data outliers – while a simple concept – can skew datasets in such a way that a single outlier can (in theory) distort the reality of the data presented. With that in mind, this blog will take a look at why these data outliers appear and the best methods for treating them.
The Importance of Standardization
Standardization is an often-essential pre-processing step when analyzing machine learning datasets. It allows different data to be compared using a common scale without distorting effects caused by large differences in data range (for example, age and wealth), or that have units (such as weight and distance).
These differences, if left unstandardized, will impact machine learning models with subsequent analyses being more influenced by the larger values of one type of data versus the other.
You can see this demonstrated in Figure 1 below, which is an example of non-standardized vs standardized data sets. If left unstandardized, the increased data range and value of variable 2 will give it greater influence over the machine learning predictions than variable 1.
 Figure 1: Non-standardized vs Standardized datasets
One of the most common methods of standardization is the z-score, which transforms the probability distribution to a standard Gaussian function with a mean of 0 and a standard deviation of 1.
However, standardized data can become skewed or biased if the input variable contains outlier values, affecting the accuracy of your predictive machine learning models, as well as causing longer training times and giving poorer results.
What is an Outlier?
Outliers are extreme values. They are the observations that fall a long way outside the expected range. For instance, these would be the values on the tails of a normal distribution and to include them will cause tests to either miss the required findings or, in some cases, distort the real results.
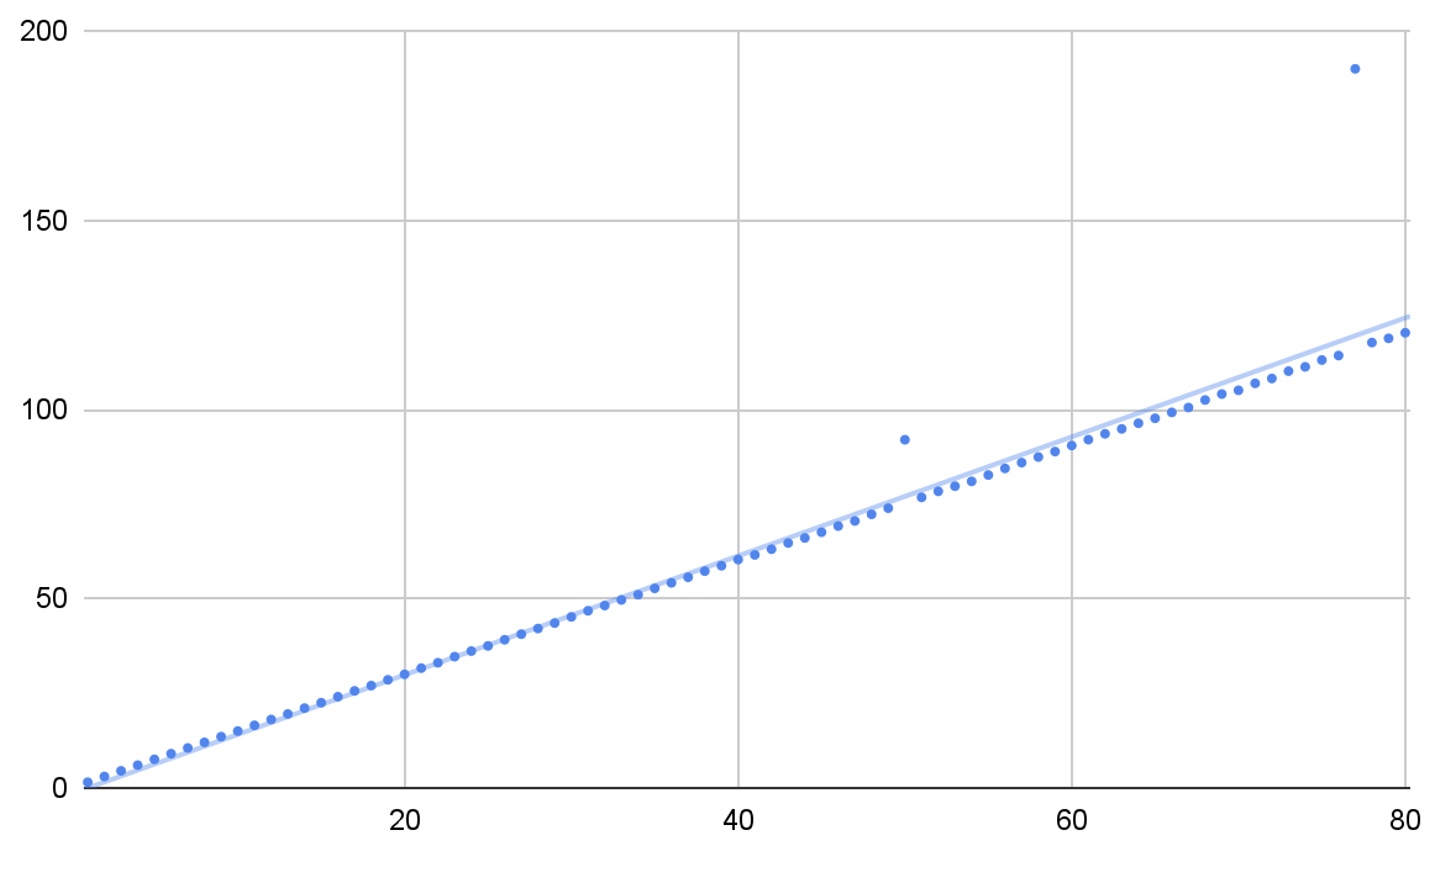
Their effect on the predictive nature can be seen in Figure 2 below.
Note – for simplicity, a single (non-standardized) data set has been created for this example, using a function of x with randomly generated variation. Two outliers are present, which have caused a variation between the predicted value (trendline) and the observed values.
 Figure 2: Impact of data outlier on predictive model
Not all extreme values are outliers and the unique nature of each dataset means there is no precise way to define and identify outliers, so the key is to bring in a domain expert to help identify them early on in the process.
To make things more complex, outliers are (by their very) nature rare, and therefore few examples will exist with which to train a neural network. Indeed, the legitimacy of eliminating an outlier from datasets is a common question in academic discussion forums.
In response to such a question about an extreme value in a climatological data set, Dr. James Knaub defines this legitimacy in the following manner:
“If it is a valid datum you have collected, say without equipment error, then it is not an outlier…a better definition of “outlier” is a datum that does not belong to your population.”
Dr Knaub also goes on to state ”Remember that 0.1% of the data should be in a 0.1% tail. If you throw them out, you are throwing out good data, not ‘outliers.’”
And Knaub is right. It’s vital not to throw away good data since doing so will also affect the predictive ability of a machine learning algorithm.
So, how do you detect outliers to ascertain if they are an error or just normal variation?
Modelling Outliers
One of the best references for this conundrum is Charu C Aggarwal’s book Outlier Analysis. In it, Aggarwal provides an overview of the most important models and outlines the settings in which they might work well.
Aggarwal’s work examines different methods of treating outliers, from the most basic, extreme value analysis, through to modelling techniques such as probabilistic / statistical, spectral, proximity-based, information theoretic and high-dimension outlier detection.
All these methods are worth consideration and a deeper dive, but for the sake of brevity, we will look at three established paths that can identify or eliminate them: univariate modeling, the multivariate model and the Minkowski error.
1. Univariate Modelling to Remove Extreme Outliers
Starting with the simplest method, this looks for data points with extreme values on one variable.
Take the below example, which uses the same data as above, with the data following (approximately) the function y = 1.5x, but with a random function used to create natural variation in the data. Two outliers have been purposefully introduced at x=50 (y=92) and x=77 (y=190).
As we see in Figure 2, this throws out the predictive model. In Figure 3 below, we can identify the extreme data outlier by integrating univariate modeling into the test process.
 Figure 3: Identifying the extreme outlier using a univariate model
We see an extreme outlier that can be best highlighted with a box plot of the quartile range and min / max values.
By evaluating this data point to understand if it is an error, a data point that should be identified and treated separately (for example, a reaction to a drug / vaccine by a particular population), or a legitimate point that should be included in the predictive model (in this case it’s an error).
Figure 4 shows this correction.

Figure 4: using a univariate approach to identify and eliminate an outlier from the dataset
But, by taking a univariate approach, we miss the second outlier and a second, multivariate approach, is needed.
2. Multivariate Method to Identify Unusual Combinations Outside of The Standard Distribution Tails
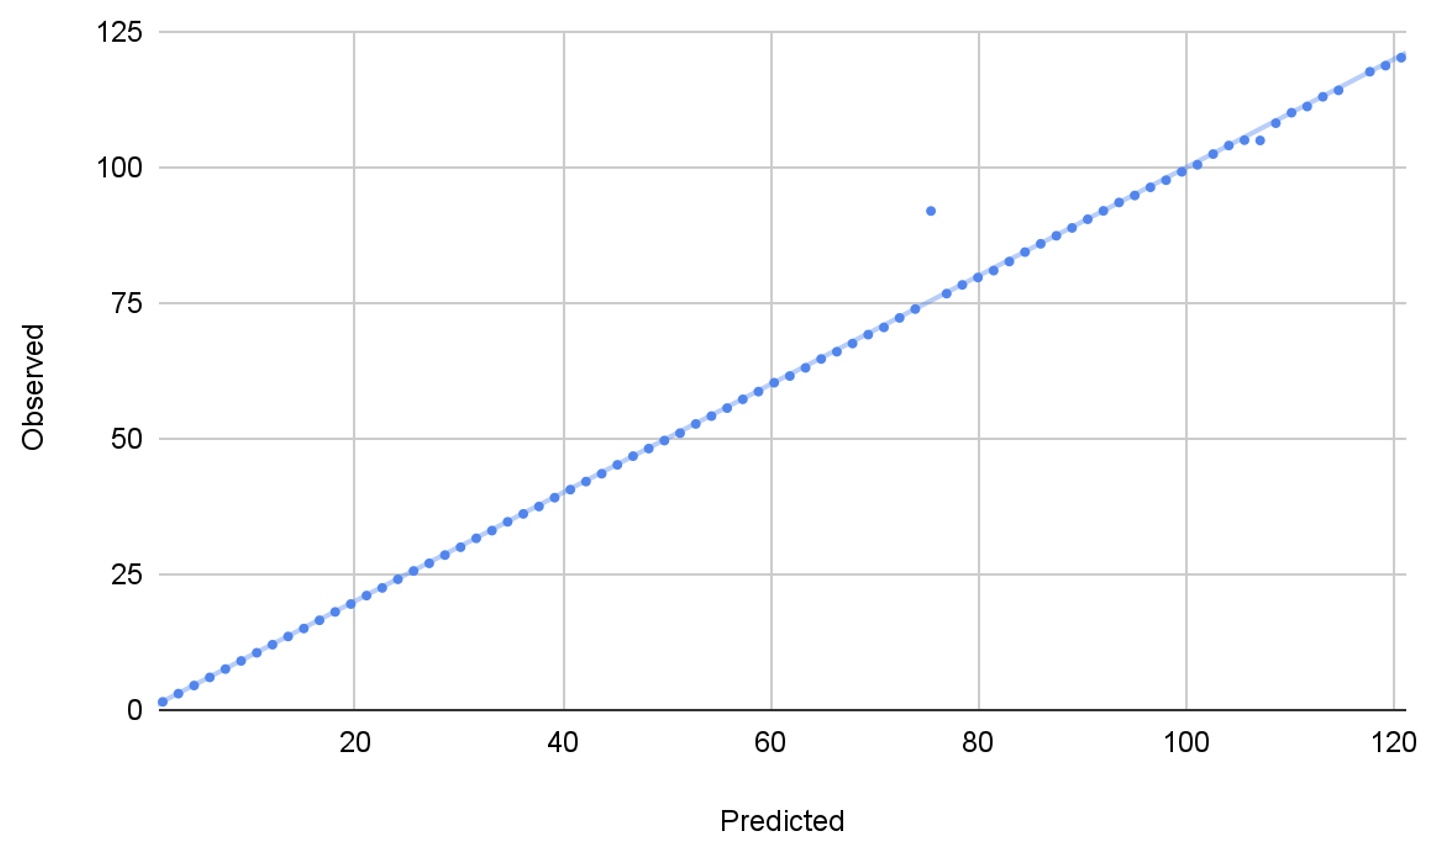
The multivariate model instead looks for unusual combinations of the variables. For this method, we use a linear regression analysis to create a predicted plot and compare the difference in these values to the observed to identify the most extreme outliers.
Using the same data set as above (minus the extreme outlier), our linear regression analysis creates the following graph, with the line of best fit plotted too.
 Figure 5: Plotting observed vs predicted values to quantify an outlier
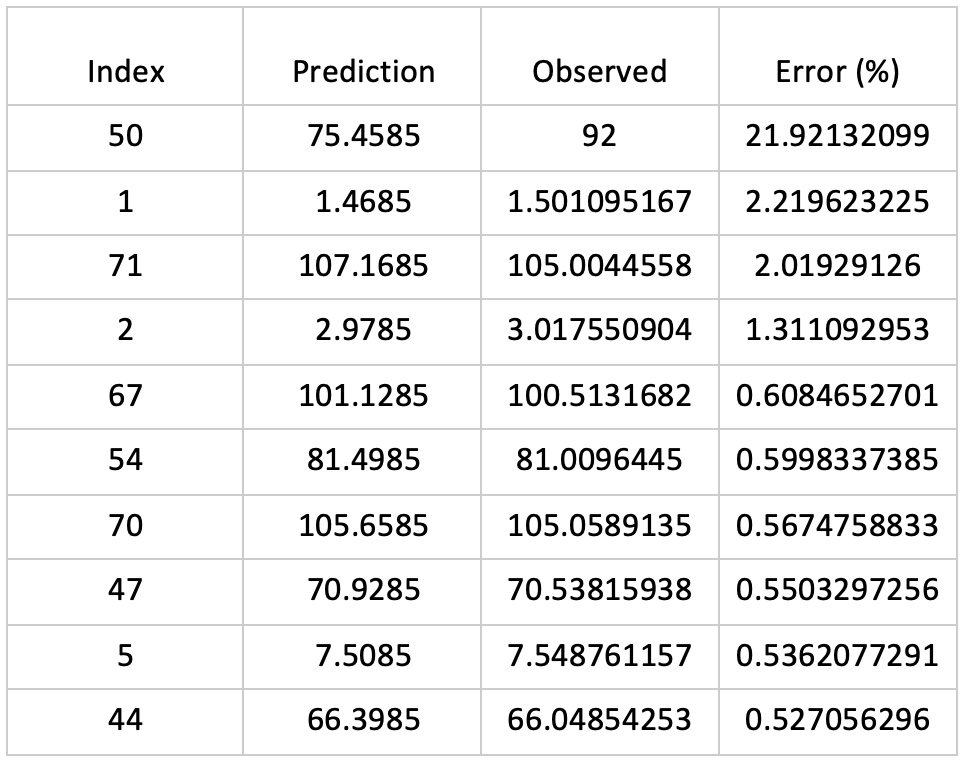
We can see that the point is an outlier, and to quantify this outlier, we can calculate the error between our observed and predicted data, with the 10 highest errors in the table below:
 As we can see, there is a large natural break in errors between this point and the rest of the data. And the machine learning algorithms can be set to eliminate all points with an error above a threshold – in this case c.10%.
3. Minkowski Error to Minimize the Effect of Outliers
The final method, doesn’t attempt to clean detected outliers, instead it mitigates their effect on the rest of the data.
It does this by adapting the mean-squared error calculation, raising each instance error to the Minkowski parameter, a variable lower than 2 and typically around 1.5.
For example, an outlier with an instance error of 5, and using a Minkowski parameter of 1.5, would have a Minkowski error of 11.18, vs a squared error of 25. Similarly, an error of 20 would have a Minkowski error of 89.44 vs 400.
In short, these outliers don’t have the same influence on the neural network’s predictive models as the others would have.
Its effects can be seen well in a sin / cos wave with errors introduced. Using a mean-squared error calculation the training process is susceptible to outliers.
 Figure 6: Using the Minkowski error enables training processes to be less susceptible to errors
Putting Datasets to Work by Addressing Outliers
The very nature of outliers means that they are rare and there is no standard method that can be deployed to identify them and mitigate their effect, yet their effect on machine learning algorithms can be significant.
Neural networks are already training systems that relate to pharmaceutical development, digital health, banking and financial services, security and transportation (to name but a few). This increased integration makes it vital that data outliers are identified as early as possible, thereby ensuring that the machine learning models are more accurate.
The above three methods are complementary and we may need to deploy multiple (or even all of these) methods to ensure no outliers are affecting the predictive algorithms being developed. Data outliers may have the capacity to distort reality, but being able to understand why a deviation is happening and the means to correctly read the data will be a critical part of ensuring that your machine learning algorithms will not be thrown off by a random element.
Data is now a valuable commodity, so the need to accurately analyze the information and actionable insights becomes ever more pressing. Our team of team of digital engineers has the experience and knowledge to ensure that you have the right foundation from day one.
To find out how Apexon can provide the solutions to the most difficult digital challenges, contact us by filling out the form below.


